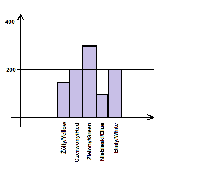
Sometimes we want to illustrate how many the same elements are in collection. Let's consider an example of children's pool with plastic balls. Let say there are 1000 of them and we can distinguish 5 colors (yellow, red, green, blue, white). To show, on one chart, how many balls are in each color, we need to take each ball and count. Sum for given color will be presented as one bar on chart. Axis X is a type of color and axis Y is a sum value.

This is how we get a histogram. In reference to pictures it is used to show how many of each color was used in the picture. Recently, I needed such analyze to one of my projects. OpenCV offers a ready function for that calcHist(...). I used it to compare if my algorithm works properly and gives the same results. This is how I got a simple app that takes as an parameter a path to image and returns its histogram.
Algorithm
In case of this app, I'm interested in gray scale histogram. This is why, after a reading a file it is converted into such color palette. To get a desired histogram, we need to define bins from a whole spectrum. For the gray scale, each pixel can get a value from 0 (black) to 255 (white). I wanted to get a whole range, so the implementation is for 256 bins and there is a 256 bars on a chart. Now, itereting over all elements, I'm checking its value and add one to the sum for given color.
for (uint16_t r = 0; r < gray.rows; ++r) {
const uint8_t* row = gray.ptr
(r); for (uint16_t c = 0; c < gray.cols; ++c)
frequency[row[c]] += 1;
}
}
Pictures differs with content and size. That gives a different number of pixels with the same color (e.g. white) between two of them. Because this makes harder to get one universal top value for the chart, I used a normalization, a type of scale, where top value is defined for maximum value and remaining ones are scaled accordingly.
for (uint16_t x = 0; x < histSize - 1; ++x) {
  histVector[x] = (uint32_t)((100.0 / max) * histVector[x]);
}
Exampled pictures:


